
Last week I wrote a post at On The Left about “WINZ-speak” and how much of it is deliberate bureaucratic miscommunication. I wanted to say a few more things about the government’s plans to reduce beneficiary numbers, and what those stats look like. In a word: scary.
Reading the comments on the original On The Left article reminded me just widespread, endemic, and deepset the issue of beneficiary treatment in New Zealand is.
And it’s top of the government’s agenda. Not helping the people who need it – oh no. God fobid.
In this, their third term, the National government plans reduce beneficiary numbers by 25 per cent. Twenty five percent. That’s massive. That’s diabolical.
How exactly do they plan to do this? I’m not clear. But I wanted to have a look at some numbers. Disclaimer: I’m not great at maths, so if I screwed any of this up, let me know. I have rounded, not used decimals.
Here’s some key points from the latest MSD benefit statistics.
At the end of September 2014:
- 294,321 working-age people (18-64yrs) were receiving a main benefit. (“main benefit” includes Jobseeker Support, Sole Parent, Supported Living Payment, and Youth/Young Parent Payment.)
- 10.7% of the working-age population of New Zealand were receiving a main benefit.
- 58% of main benefit recipients were female, 42% male.
- 42% on main benefits were receiving Jobseeker Support, 32% Supported Living Payment and 25% Sole Parent Support.
- Nearly three quarters (74%) of recipients of main benefits had been receiving their current benefit continuously for more than one year.
- Compared to September 2013, the number of recipients of main benefits decreased by 10,073, or 3 percent. This was largely driven by decreases in Sole Parent Support and Jobseeker Support numbers.
One of my first questions with these numbers, is how they take into account the 2013 welfare reforms that rolled the Sickness Benefit into the Unemployment Benefit and renamed it Jobseeker Support. Anyone want to hazard a guess?
The other thing I notice is the 10.7%. That’s just such a small number. 294,321 people needing some form of support or assistance, because they’re out of work, because they’re ill or have a disability, because they’re raising kids. It seems perfectly acceptable to me that 10% of our “working age” population would be assisted by welfare. We’re a democratic welfare state. So why is there such continual outcry about it?
25% of 294,321 is 73,580 people off benefits over the next three years.
Approximately 24,526 a year.
More than 471 a week.
So: is there 73,580 suitable, sustainable jobs for them to go into? And if not, what happens to them?
According to National’s website, they’ve been getting 1600 people a week off welfare. And they’re damn proud of themselves for it.
This figure was questioned by RadioNZ during their pre-election Fact or Fiction series
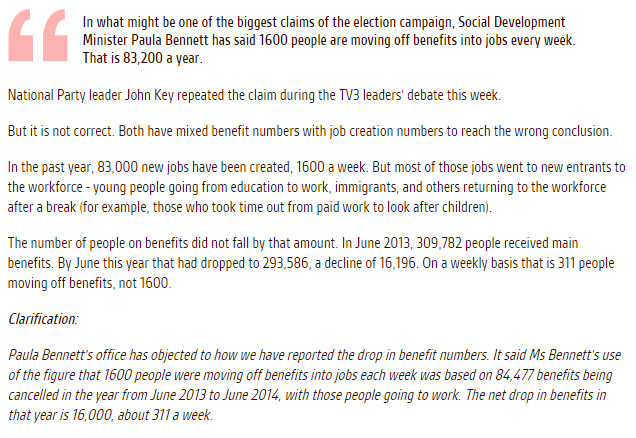
“Benefits being cancelled, hey?” Again – how much of this was welfare reforms moving people from Sickness Benefits to the newly created Jobseeker Support? And if we’re at a net drop of 311 a week in the past year, then that predicted 471 above looks even more scary.
It’s hard to find the truth amongst all these numbers. How many of these people stay off the benefit – or have they been forced into unsuitable, unsustainable work and returned a few weeks later? How many have moved from one benefit to another? How many simply gave up because, like I said at On The Left, WINZ is just so difficult to deal with? How many left the country altogether?
I wouldn’t calling forcing people out of assistance they’re entitled to a win.
But the National government does. And the numbers are saying it all – WINZ wins again.
“So: is there 73,580 suitable, sustainable jobs for them to go into? And if not, what happens to them?”
A superb question that I’d love to see an answer to!
Pingback: Online activism – Who? How? Why? | On The Left
Thanks for your excellent research and clarification.
Surely it is churn: 84,000 benefits cancelled, with a net drop of 16,000 means that 68,000 people started on benefits during that time. Given the percentages above, that would be 17,000 new sole parents (That sounds about right, out of 58,000 live births), and more than 28000 jobs lost (some will be sackings, but a good proportion will be reduncancy).
If the government supported/”employed” one parent/caregiver in each family to have the job of “staying at home & raising the children” then there would be a lot more jobs available to job seekers. I think this would also mean healthier & happier families as cooking good food and caring for children (of all ages) etc is a full time job. Instead the govt essentially forces parents to give up their children to the system, and get a job – a job that could have gone to someone with no other responsibilities.
Pingback: All WINZ and no play | Writehanded